WBD max pain, gamma exposure (GEX) & options open interest
As of close · rank #35 by open interest · 1,052 sessions of history since Apr 11, 2022
WBD's nearest-expiration max pain is 29.00 for 2026-10-09, its GEX flip is 23.36, net GEX is 229,259,525, its put/call open-interest ratio is 2.87. These are whole-chain derived aggregates as of Oct 2, 2026 close.
Whole-chain analytics
Derived after the close from the same dated options chain. Signed gamma exposure uses calls positive and puts negative; it is a model convention, not observed dealer inventory.
Advanced options analysis
Complete derived analysis from the dated chain, normalized where possible for comparison across tickers. Catalyst intensity measures unusual pricing and activity; it does not identify an event, predict direction, or establish that an investment is attractive.
Strongest relative signals: front IV premium 0.3 pp · 25Δ risk reversal 13.2 pp
WBD closed right at its gamma max of 30.94. It is 1.7% above the delta neutral price of 30.41. Total open interest is 2,734,241, -5.1% versus the previous session. Its options catalyst-intensity score is 50.7 out of 100, led by front IV premium 0.3 pp, 25Δ risk reversal 13.2 pp. What gamma max means · What delta neutral means
Call versus put open interest changes
Growth compares outstanding contracts on each side. A positive growth gap favors calls; a negative gap favors puts. Standardized surprises compare each measure with its own prior history. These describe the OI balance, not IV skew or buying direction.
| Measure | Value |
|---|---|
| Call OI change, 1 session | -48,117 contracts · -6.4% |
| Put OI change, 1 session | -99,155 contracts · -4.7% |
| Call minus put OI growth, 1 session | -1.7 pp |
| Call OI change, 5 sessions | -42,676 contracts · -5.7% |
| Put OI change, 5 sessions | -8,963 contracts · -0.4% |
| Call minus put OI growth, 5 sessions | -5.3 pp |
| Daily call OI change surprise | -0.65σ (252 prior changes) |
| Daily put OI change surprise | -1.53σ (252 prior changes) |
| Daily call-minus-put growth surprise | -0.34σ (252 prior changes) |
History
Hover for valuesDrag to panScroll to zoomClick a series to hide it ← → step a session+ − zoomTouch: swipe to pan, pinch to zoom, hold for the crosshair
Analysis visualizations
Derived from the 2026-10-02 options chain. Select an analysis to explore its chart.
No matching visualizations.
Gamma walls
Chart loads when this section is in view.
What followed prior gamma-max crosses?
Each historical path starts at 0% on the cross date and follows the close for ten subsequent trading sessions. Cohorts use the same direction as labelled and require gamma max to be within 10% of the close on both crossing sessions.
Crosses below gamma max 12 completed Day +10 paths · latest Dec 16, 2025
| Horizon | n | Median | Middle 50% | Above zero | Nominal ≥90% median interval | Confidence floor |
|---|---|---|---|---|---|---|
| Day +1 | 12 | +0.2% | -1.3% to +1.5% | 50% | -2.4% to +1.6% | 0.0% |
| Day +2 | 12 | +0.6% | -1.6% to +1.8% | 67% | -4.0% to +2.1% | 0.0% |
| Day +3 | 12 | +0.6% | -2.4% to +1.9% | 58% | -3.7% to +2.8% | 0.0% |
| Day +4 | 12 | +1.3% | -0.7% to +2.3% | 58% | -1.0% to +2.6% | 0.0% |
| Day +5 | 12 | +1.9% | +0.0% to +3.5% | 75% | -1.2% to +3.8% | 0.0% |
| Day +6 | 12 | +2.6% | +0.1% to +3.2% | 75% | -2.4% to +3.4% | 0.0% |
| Day +7 | 12 | +1.6% | -1.0% to +4.2% | 58% | -2.5% to +5.0% | 0.0% |
| Day +8 | 12 | +3.0% | -0.8% to +5.2% | 58% | -1.2% to +5.7% | 0.0% |
| Day +9 | 12 | +3.8% | -0.1% to +5.7% | 75% | -0.9% to +6.0% | 0.0% |
| Day +10 | 12 | +3.5% | -0.8% to +6.6% | 67% | -2.3% to +7.2% | 0.0% |
Crosses above gamma max 15 completed Day +10 paths · latest Dec 12, 2025
| Horizon | n | Median | Middle 50% | Above zero | Nominal ≥90% median interval | Confidence floor |
|---|---|---|---|---|---|---|
| Day +1 | 15 | +0.7% | -1.6% to +1.5% | 53% | -1.9% to +1.5% | 0.0% |
| Day +2 | 15 | +0.5% | -3.5% to +2.3% | 53% | -3.6% to +2.9% | 0.0% |
| Day +3 | 15 | +0.3% | -2.3% to +1.9% | 53% | -2.6% to +2.2% | 0.0% |
| Day +4 | 15 | +1.5% | -4.2% to +4.4% | 53% | -4.9% to +5.3% | 0.0% |
| Day +5 | 15 | +2.0% | -1.7% to +3.5% | 67% | -3.1% to +3.7% | 0.0% |
| Day +6 | 15 | +3.2% | -1.3% to +4.9% | 67% | -1.8% to +5.0% | 0.0% |
| Day +7 | 15 | +0.8% | -2.4% to +4.0% | 53% | -2.8% to +4.0% | 0.0% |
| Day +8 | 15 | +3.2% | -0.6% to +6.1% | 73% | -2.5% to +6.6% | 0.0% |
| Day +9 | 15 | +3.5% | -1.7% to +5.1% | 73% | -3.9% to +5.9% | 0.0% |
| Day +10 | 15 | +4.2% | -3.5% to +6.6% | 67% | -4.0% to +6.8% | 0.0% |
Returns are close-to-close after the labelled number of subsequent trading sessions. The confidence floor is the closest-to-zero bound of the order-statistic median interval; it is zero when that interval spans zero. Its coverage is nominally at least 90% under independent observations. Historical paths can overlap, so the interval and floor are descriptive uncertainty guides rather than formal coverage guarantees. Historical, not a forecast.
Last 252 sessions
| Sessions closed above gamma max | 6% |
| Gamma max crosses | 14 |
| Delta neutral crosses | 14 |
| Prior-year sessions closer to gamma max | 0.0% of 252 |
| Prior-year sessions closer to delta neutral | 17.1% of 252 |
| Open interest percentile (1y) | 86th |
| Daily open interest change versus prior year | -1.12σ (-147,272 contracts; 252 prior changes) |
| Open interest change, 5 sessions | -1.9% |
| Open interest change, 21 sessions | -6.2% |
| History available | Apr 11, 2022 → Oct 2, 2026 |
Recent crosses
- closed above delta neutral at 30.80 vs 28.75 (+6.6%)
- closed below delta neutral at 27.80 vs 28.11 (-1.1%)
- closed above delta neutral at 28.03 vs 27.88 (+0.5%)
- closed below delta neutral at 28.10 vs 28.18 (-0.3%)
- closed above delta neutral at 28.04 vs 27.85 (+0.7%)
- closed below delta neutral at 28.20 vs 28.26 (-0.2%)
- closed above delta neutral at 27.91 vs 27.86 (+0.2%)
- closed below delta neutral at 28.12 vs 28.26 (-0.5%)
- closed above delta neutral at 27.07 vs 27.05 (+0.1%)
- closed below delta neutral at 27.44 vs 27.70 (-0.9%)
In today's screens
Neighbours by open interest
Cite or embed this snapshot
Share the dated 1600×840 image or cite this canonical page. The card contains public derived aggregates, not contract-level quotes.
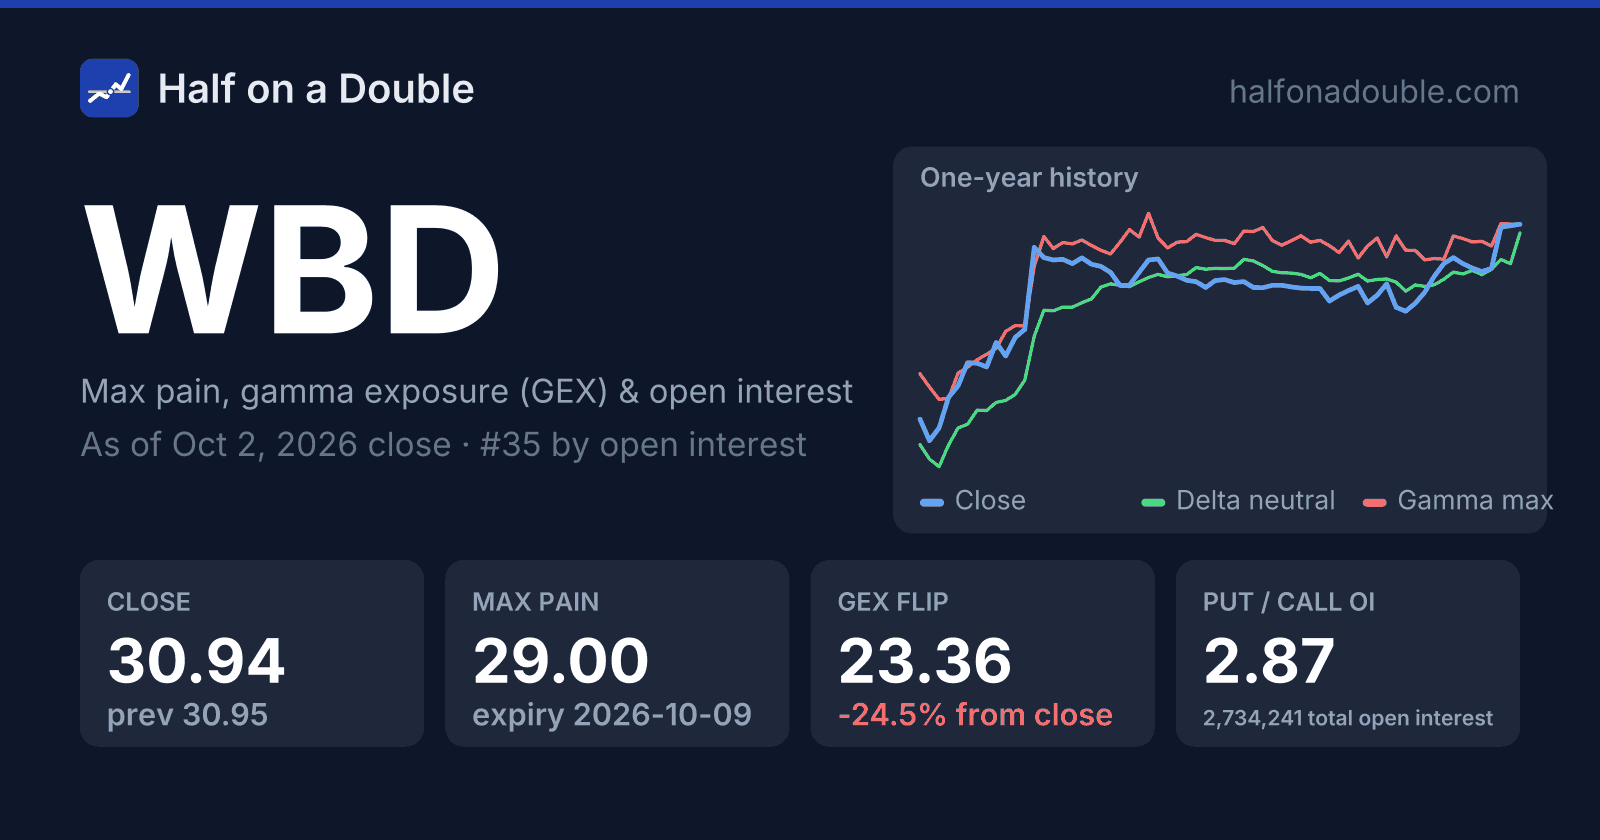
Canonical source: https://halfonadouble.com/stock/WBD
Questions people ask about WBD
Where is WBD's gamma max today?
As of Oct 2, 2026, the gamma max for WBD is 30.94, +0.0% from the 30.94 close. Gamma max is the underlying price at which the summed gamma of every open contract is largest; how it is computed and why it matters.
Is WBD above or below its delta neutral price?
WBD closed above delta neutral: 30.94 against a delta neutral price of 30.41. The delta neutral price is where the summed delta of the whole chain is zero; the definition.
How much open interest does WBD have?
2,734,241 contracts of open interest across 401 listed contracts on Oct 2, 2026, -5.1% versus the previous session. What open interest measures.
Levels are recomputed after every trading day from licensed end-of-day options data; only derived aggregates are published. Methodology · Data and licence · Not investment advice.