URNM max pain, gamma exposure (GEX) & options open interest
As of close · rank #477 by open interest · 1,409 sessions of history since Dec 1, 2020
URNM's nearest-expiration max pain is 47.00 for 2026-11-20, its GEX flip is 10.39, net GEX is 4,436,571, its put/call open-interest ratio is 0.15. These are whole-chain derived aggregates as of Oct 23, 2026 close.
URNM max pain and GEX snapshot
End-of-day snapshot for . Nearest-expiration max pain uses the expiry shown on its card; GEX uses the whole chain. Missing values are unavailable, not zero.
Prices are in US dollars per share. Net GEX is modeled dollar-delta change per $1 underlying move. Max pain minimizes aggregate intrinsic payout for that expiration; it is not a closing-price forecast. Signed GEX uses calls positive and puts negative, a model convention rather than observed dealer inventory. The flip is a confirmed zero crossing; walls locate side-specific concentrations, not guaranteed support or resistance.
Learn how to read the max pain payout example, GEX chart, gamma flip and walls, and open interest versus trading volume.
Advanced options analysis
Public aggregate analysis from the dated chain, normalized where possible for comparison across tickers. Catalyst intensity measures unusual pricing and activity; it does not identify an event, predict direction, or establish that an investment is attractive.
Strongest relative signals: 25Δ risk reversal -74.7 pp · OI change 0.06σ
URNM closed 33.4% below its gamma max of 55.76. It is 15.0% above the delta neutral price of 35.51. Total open interest is 162,846, +0.5% versus the previous session. Its options catalyst-intensity score is 27.0 out of 100, led by 25Δ risk reversal -74.7 pp, OI change 0.06σ. What gamma max means · What delta neutral means
Call versus put open interest changes
Growth compares outstanding contracts on each side. A positive growth gap favors calls; a negative gap favors puts. Standardized surprises compare each measure with its own prior history. These describe the OI balance, not IV skew or buying direction.
| Measure | Value |
|---|---|
| Call OI change, 1 session | +1,033 contracts · +0.7% |
| Put OI change, 1 session | -236 contracts · -1.1% |
| Call minus put OI growth, 1 session | +1.8 pp |
| Call OI change, 5 sessions | +4,060 contracts · +3.0% |
| Put OI change, 5 sessions | +412 contracts · +2.0% |
| Call minus put OI growth, 5 sessions | +1.0 pp |
| Daily call OI change surprise | +0.14σ (252 prior changes) |
| Daily put OI change surprise | -0.13σ (252 prior changes) |
| Daily call-minus-put growth surprise | +0.23σ (252 prior changes) |
History
Hover for valuesDrag to panScroll to zoomClick a series to hide it ← → step a session+ − zoomTouch: swipe to pan, pinch to zoom, hold for the crosshair
Analysis visualizations
Daily ticker aggregates through 2026-10-23. The max pain curve pools all listed expirations; individual contracts are outside the public dataset.
No matching visualizations.
Aggregate IV history
Chart loads when this section is in view.
Swipe chart sideways to see the full range.
What followed prior gamma-max crosses?
Each historical path starts at 0% on the cross date and follows the close for ten subsequent trading sessions. Cohorts use the same direction as labelled and require gamma max to be within 10% of the close on both crossing sessions.
Crosses below gamma max 34 completed Day +10 paths · latest Aug 28, 2026
| Horizon | n | Median | Middle 50% | Above zero | Nominal ≥90% median interval | Confidence floor |
|---|---|---|---|---|---|---|
| Day +1 | 34 | +0.1% | -1.8% to +1.9% | 53% | -1.0% to +1.2% | 0.0% |
| Day +2 | 34 | -0.1% | -2.4% to +2.0% | 47% | -1.2% to +1.3% | 0.0% |
| Day +3 | 34 | +0.6% | -3.1% to +3.0% | 53% | -2.5% to +2.2% | 0.0% |
| Day +4 | 34 | +1.0% | -3.8% to +4.3% | 53% | -2.2% to +2.4% | 0.0% |
| Day +5 | 34 | +0.9% | -4.4% to +3.6% | 56% | -2.9% to +2.8% | 0.0% |
| Day +6 | 34 | -0.2% | -5.1% to +5.3% | 50% | -3.7% to +2.4% | 0.0% |
| Day +7 | 34 | -1.3% | -5.2% to +2.9% | 44% | -4.3% to +1.2% | 0.0% |
| Day +8 | 34 | -1.1% | -5.1% to +4.9% | 44% | -3.0% to +1.8% | 0.0% |
| Day +9 | 34 | -1.9% | -6.3% to +5.5% | 41% | -3.9% to +2.0% | 0.0% |
| Day +10 | 34 | -0.2% | -4.9% to +6.2% | 50% | -4.3% to +4.5% | 0.0% |
Crosses above gamma max 34 completed Day +10 paths · latest Aug 24, 2026
| Horizon | n | Median | Middle 50% | Above zero | Nominal ≥90% median interval | Confidence floor |
|---|---|---|---|---|---|---|
| Day +1 | 34 | -0.7% | -2.0% to +1.3% | 41% | -1.6% to +1.0% | 0.0% |
| Day +2 | 34 | +0.1% | -2.9% to +2.5% | 50% | -2.4% to +2.1% | 0.0% |
| Day +3 | 34 | +0.1% | -3.8% to +3.9% | 50% | -2.1% to +1.7% | 0.0% |
| Day +4 | 34 | +0.1% | -5.0% to +3.3% | 50% | -2.9% to +1.7% | 0.0% |
| Day +5 | 34 | +0.3% | -4.4% to +5.3% | 50% | -3.5% to +4.1% | 0.0% |
| Day +6 | 34 | -1.1% | -4.6% to +5.4% | 47% | -4.1% to +2.7% | 0.0% |
| Day +7 | 34 | -1.2% | -5.5% to +6.8% | 47% | -4.7% to +4.3% | 0.0% |
| Day +8 | 34 | -0.8% | -4.4% to +6.3% | 44% | -3.8% to +3.3% | 0.0% |
| Day +9 | 34 | -0.6% | -4.4% to +6.6% | 47% | -3.4% to +5.3% | 0.0% |
| Day +10 | 34 | +0.6% | -5.1% to +8.2% | 53% | -3.9% to +6.8% | 0.0% |
Returns are close-to-close after the labelled number of subsequent trading sessions. The confidence floor is the closest-to-zero bound of the order-statistic median interval; it is zero when that interval spans zero. Its coverage is nominally at least 90% under independent observations. Historical paths can overlap, so the interval and floor are descriptive uncertainty guides rather than formal coverage guarantees. Historical, not a forecast.
Last 252 sessions
| Sessions closed above gamma max | 37% |
| Gamma max crosses | 21 |
| Delta neutral crosses | 0 |
| Prior-year sessions closer to gamma max | 76.6% of 252 |
| Prior-year sessions closer to delta neutral | 7.5% of 252 |
| Open interest percentile (1y) | 71th |
| Daily open interest change versus prior year | +0.06σ (797 contracts; 252 prior changes) |
| Open interest change, 5 sessions | +2.8% |
| Open interest change, 21 sessions | +4.2% |
| History available | Dec 1, 2020 → Oct 23, 2026 |
Recent crosses
- closed below gamma max at 56.66 vs 58.67 (-3.6%)
- closed above gamma max at 58.72 vs 58.70 (+0.0%)
- closed below gamma max at 48.25 vs 49.22 (-2.0%)
- closed above gamma max at 48.22 vs 48.05 (+0.4%)
- closed below gamma max at 61.14 vs 69.02 (-12.9%)
- closed above gamma max at 61.28 vs 35.43 (+42.2%)
- closed below gamma max at 58.22 vs 67.36 (-15.7%)
- closed above gamma max at 60.15 vs 43.29 (+28.0%)
- closed below gamma max at 68.39 vs 73.41 (-7.3%)
- closed above gamma max at 67.01 vs 41.76 (+37.7%)
In today's screens
Neighbours by open interest
Cite or embed this snapshot
Share the dated 1600×840 image or cite this canonical page. The card contains public derived aggregates, not contract-level quotes.
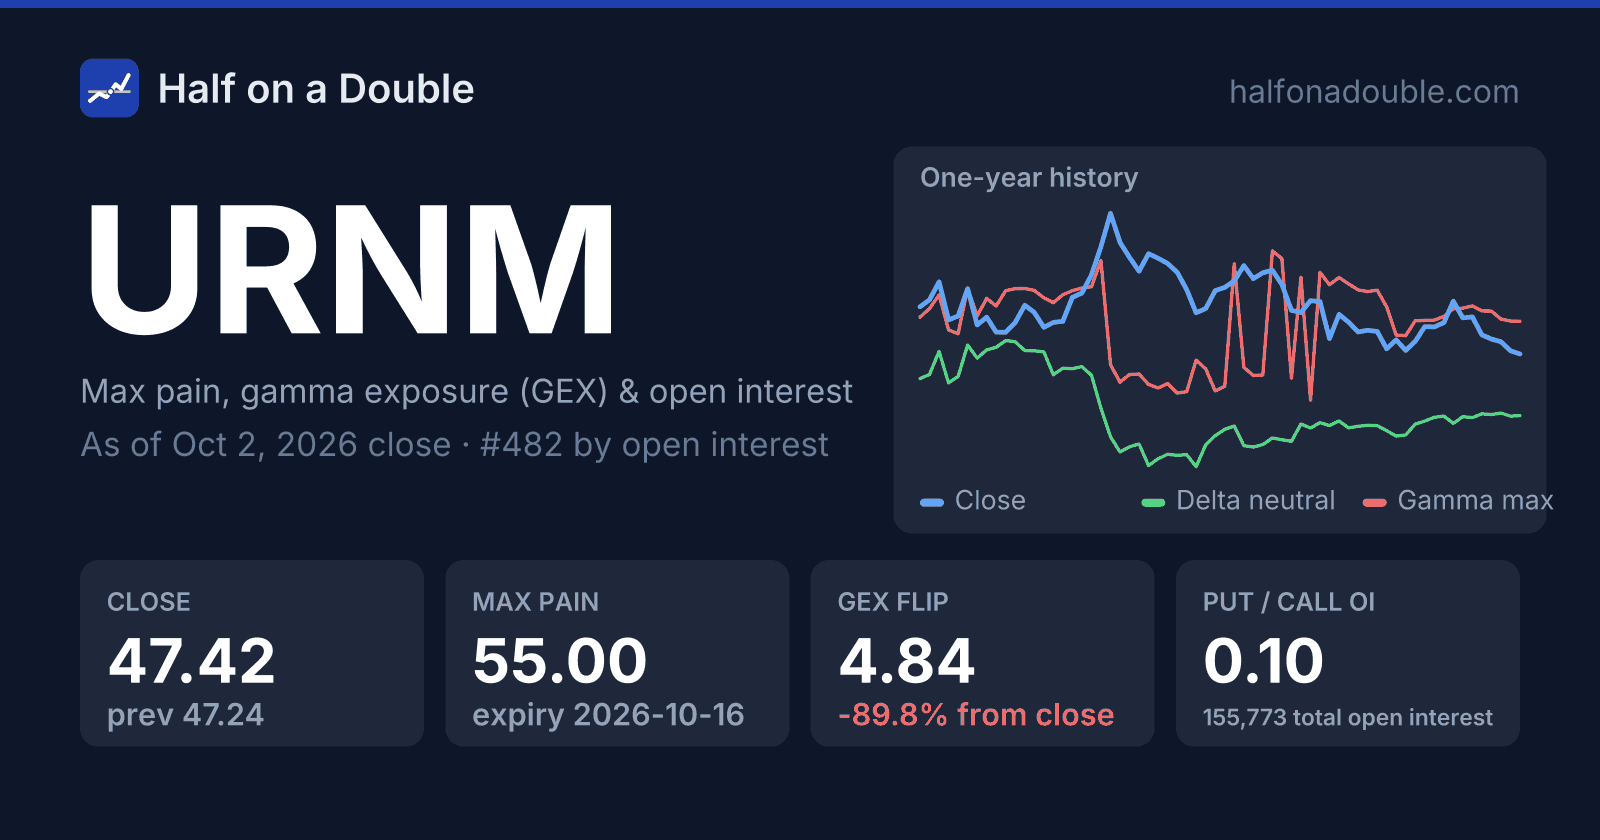
Canonical source: https://halfonadouble.com/stock/URNM
Questions people ask about URNM
What is URNM's max pain for the nearest expiration?
As of Oct 23, 2026 close, nearest-expiration max pain is 47.00 for the 2026-11-20 expiration. It is a payout-minimizing strike for one expiration. An all-expiration pooled value is a different comparison, and neither establishes where the underlying will close. Max pain definition and worked payout example.
Our 2025 max-pain study compares historical Thursday levels with Friday underlying closes and an unchanged-price baseline. Its scope and results are separate from this current ticker snapshot.
What do URNM's gamma exposure and gamma flip show?
Signed net GEX is 4,436,571 as of Oct 23, 2026 close. The confirmed GEX flip is 10.39. These aggregate model outputs use calls positive and puts negative. Their sign does not identify dealers' actual positions or predict the next move. How to interpret GEX, gamma flip and walls.
Where is URNM's gamma max today?
As of Oct 23, 2026, the gamma max for URNM is 55.76, +33.4% from the 41.79 close. Gamma max is the underlying price at which the summed gamma of every open contract is largest; how it is computed and why it matters.
Is URNM above or below its delta neutral price?
URNM closed above delta neutral: 41.79 against a delta neutral price of 35.51. The delta neutral price is where the summed delta of the whole chain is zero; the definition.
How much open interest does URNM have?
162,846 contracts of open interest across 318 listed contracts on Oct 23, 2026, +0.5% versus the previous session. What open interest measures.
Levels are recomputed after every trading day from licensed end-of-day options data; only derived aggregates are published. Methodology · Data and licence · Not investment advice.