Original research · Retrospective comparison
Does max pain predict expiration price? A 2025 comparison
Published by Half on a Double · · Sources and editorial standards
Planned study: calendar 2025 · Observed outcomes: –
Archive reconstructed September 2026. This historical study has its own coverage dates, separate from the current daily data above.
We compared archived Thursday max-pain levels with the underlying’s reported Friday close. Each level referred to options expiring that Friday. The baseline was Thursday’s close: a forecast that the underlying price would remain unchanged. The archive was reconstructed in September 2026, so this is a retrospective comparison of dated observations, not a record of forecasts published in 2025.
The outcome is the source-reported underlying close. It is not an independently verified official option settlement value. Index settlement conventions and adjusted option deliverables can differ from that close.
Thursday’s close was closer on average in this sample
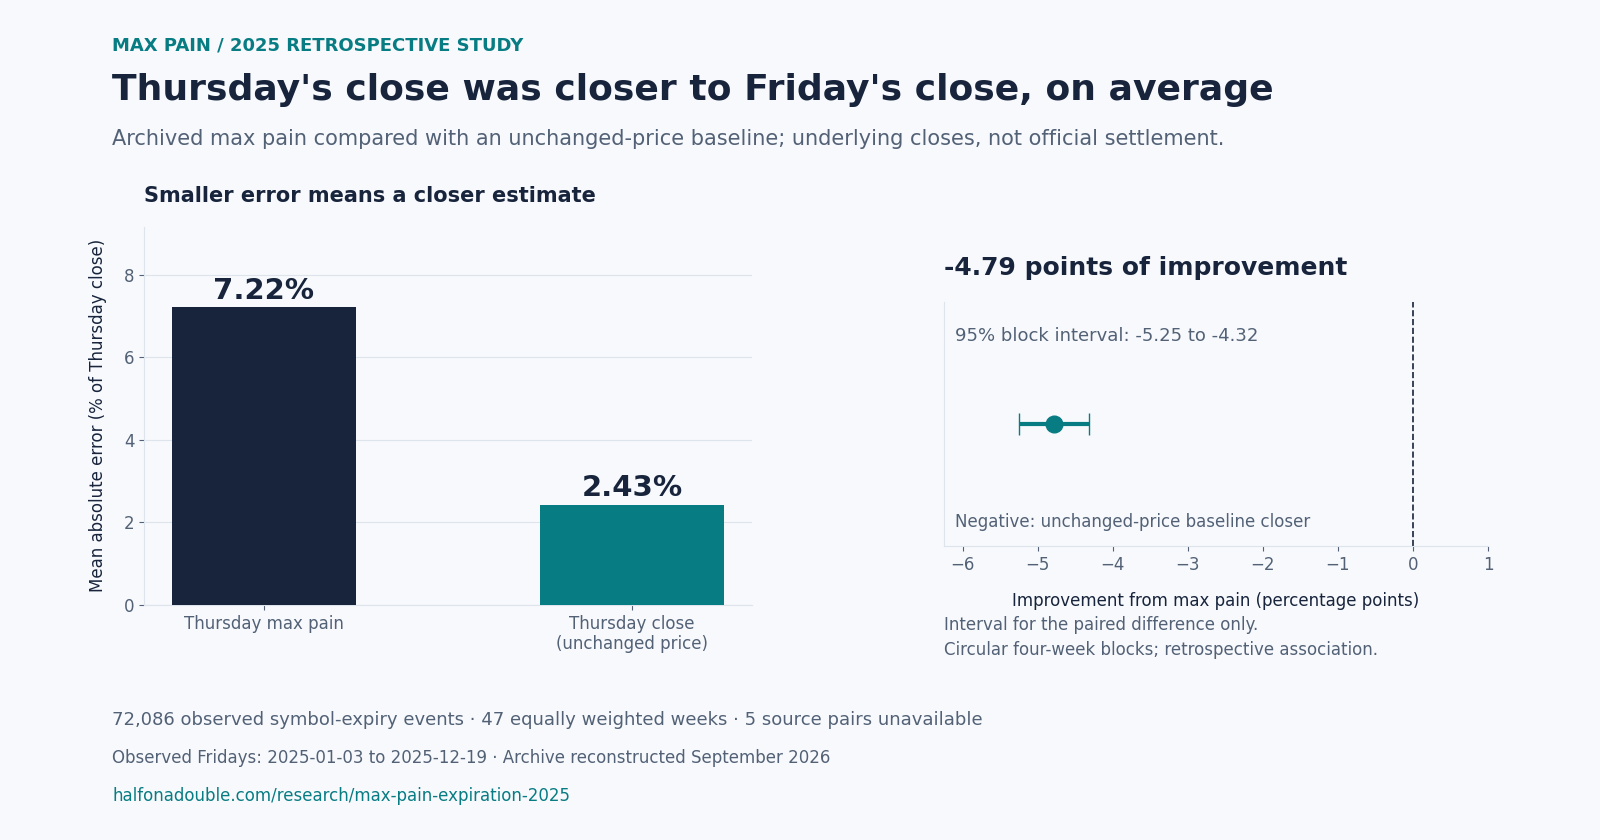
With each observed expiry week weighted equally, max pain’s mean absolute error was 7.22% of Thursday’s price, compared with 2.43% for an unchanged-price forecast. The paired improvement from using max pain was -4.79 percentage points, with a 95% circular-block interval of -5.25 to -4.32 points. Negative improvement means the unchanged-price baseline was closer under this comparison.
Error using max pain
7.22%
Relative to Thursday’s price · equal weight per week
Error using Thursday’s close
2.43%
Relative to Thursday’s price · equal weight per week
Improvement from max pain
-4.79 points
Relative to Thursday’s price · equal weight per week
| Measure | Value |
|---|---|
| Max-pain mean absolute error | 7.22% of Thursday close |
| Unchanged-price mean absolute error | 2.43% of Thursday close |
| Mean paired improvement | -4.79 percentage points |
| 95% circular four-week block interval | -5.25 to -4.32 percentage points |
What was included—and what was missing
The schedule contained 52 Fridays. Both source files existed for 47 Thursday/Friday pairs, all of which supplied eligible outcomes. Those pairs contained 6,091 distinct Thursday symbols; 5,982 passed Thursday eligibility, and 5,842 had an observed Friday outcome. The analysis retained historical source symbols without selecting today’s survivors or indexable ticker pages.
All symbol/event totals below cover only the 47 complete source pairs. Counts for the five incomplete weeks are unknown. Rows were excluded in the order shown, so each exclusion is counted once. The 942 eligible observations missing Friday’s symbol were censored, without substituting a later price.
| Classification | Rows |
|---|---|
| Thursday source rows | 240,854 |
| Excluded: invalid or absent expiration | 0 |
| Excluded: nearest expiration was not the following Friday | 167,826 |
| Excluded: invalid or nonpositive Thursday close | 0 |
| Excluded: invalid or nonpositive max pain | 0 |
| Excluded: invalid, nonpositive or noninteger total open interest | 0 |
| Eligible using Thursday information | 73,028 |
| Censored: symbol absent from Friday file | 942 |
| Censored: invalid or nonpositive Friday close | 0 |
| Observed matched outcomes | 72,086 |
| Thursday | Friday | Thursday file | Friday file |
|---|---|---|---|
| 2025-01-09 | 2025-01-10 | Absent | Present |
| 2025-04-17 | 2025-04-18 | Present | Absent |
| 2025-06-19 | 2025-06-20 | Absent | Present |
| 2025-07-03 | 2025-07-04 | Present | Absent |
| 2025-12-25 | 2025-12-26 | Absent | Present |
Every scheduled expiry week
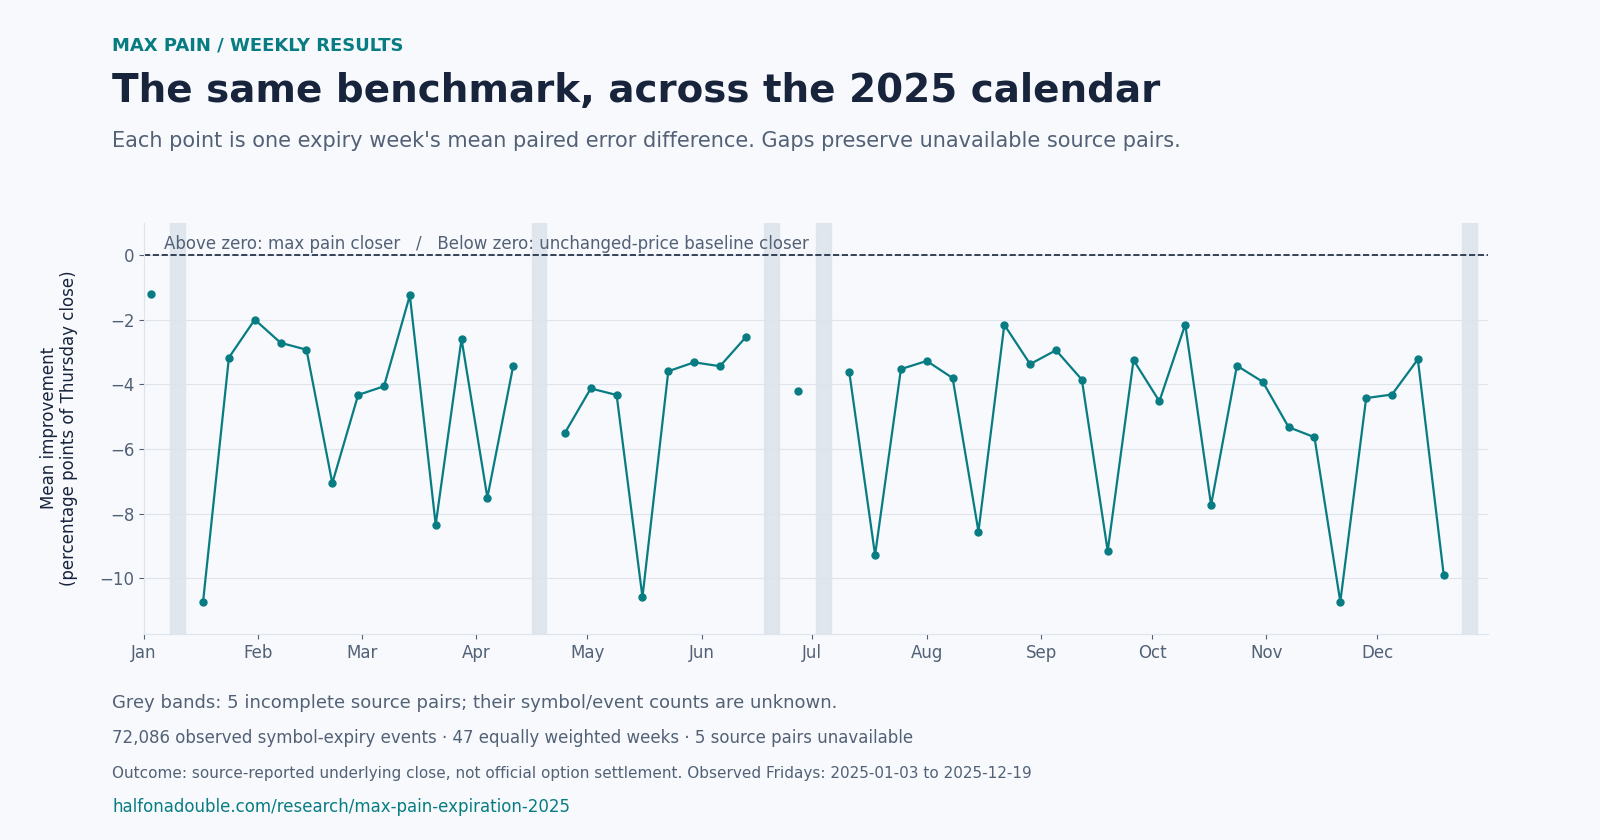
The table retains all 52 calendar rows. Errors are percentages of Thursday’s price; improvement is their paired difference in percentage points. Positive improvement means max pain was closer, and negative means Thursday’s close was closer. Unavailable source pairs have unknown event counts and no estimated result.
| Friday | Thursday eligible | Observed | Max-pain error | No-change error | Improvement |
|---|---|---|---|---|---|
| 620 | 620 | 4.13% | 2.92% | -1.20 points | |
| Source pair unavailable | Unknown | Unknown | Unavailable | Unavailable | Unavailable |
| 4,714 | 4,633 | 12.20% | 1.48% | -10.72 points | |
| 631 | 630 | 4.84% | 1.67% | -3.17 points | |
| 641 | 641 | 3.89% | 1.89% | -2.00 points | |
| 639 | 638 | 4.90% | 2.18% | -2.72 points | |
| 639 | 639 | 5.09% | 2.16% | -2.93 points | |
| 4,794 | 4,701 | 9.88% | 2.83% | -7.06 points | |
| 640 | 640 | 6.56% | 2.23% | -4.33 points | |
| 634 | 634 | 6.45% | 2.39% | -4.06 points | |
| 636 | 636 | 5.09% | 3.84% | -1.25 points | |
| 4,735 | 4,646 | 9.79% | 1.45% | -8.34 points | |
| 636 | 634 | 5.70% | 3.11% | -2.60 points | |
| 639 | 638 | 14.30% | 6.79% | -7.50 points | |
| 642 | 640 | 6.07% | 2.64% | -3.43 points | |
| Source pair unavailable | Unknown | Unknown | Unavailable | Unavailable | Unavailable |
| 640 | 638 | 7.31% | 1.81% | -5.50 points | |
| 650 | 649 | 7.11% | 2.98% | -4.13 points | |
| 653 | 651 | 6.39% | 2.05% | -4.33 points | |
| 4,737 | 4,656 | 12.22% | 1.64% | -10.58 points | |
| 654 | 653 | 5.56% | 1.96% | -3.60 points | |
| 662 | 660 | 5.25% | 1.94% | -3.32 points | |
| 655 | 655 | 5.94% | 2.50% | -3.44 points | |
| 653 | 653 | 5.35% | 2.81% | -2.54 points | |
| Source pair unavailable | Unknown | Unknown | Unavailable | Unavailable | Unavailable |
| 654 | 652 | 5.92% | 1.73% | -4.20 points | |
| Source pair unavailable | Unknown | Unknown | Unavailable | Unavailable | Unavailable |
| 651 | 650 | 5.63% | 2.02% | -3.61 points | |
| 4,760 | 4,685 | 10.81% | 1.52% | -9.28 points | |
| 655 | 652 | 5.14% | 1.61% | -3.53 points | |
| 667 | 667 | 6.28% | 3.00% | -3.28 points | |
| 665 | 665 | 5.99% | 2.19% | -3.81 points | |
| 4,818 | 4,741 | 10.16% | 1.61% | -8.55 points | |
| 672 | 672 | 5.79% | 3.63% | -2.16 points | |
| 678 | 675 | 5.31% | 1.93% | -3.38 points | |
| 665 | 665 | 5.06% | 2.11% | -2.95 points | |
| 664 | 664 | 5.92% | 2.06% | -3.86 points | |
| 4,995 | 4,888 | 11.28% | 2.12% | -9.16 points | |
| 671 | 669 | 5.01% | 1.76% | -3.25 points | |
| 674 | 673 | 6.49% | 1.97% | -4.52 points | |
| 681 | 680 | 6.85% | 4.70% | -2.15 points | |
| 5,027 | 4,912 | 11.04% | 3.31% | -7.73 points | |
| 679 | 679 | 5.79% | 2.37% | -3.42 points | |
| 700 | 700 | 6.29% | 2.37% | -3.92 points | |
| 687 | 686 | 7.65% | 2.33% | -5.32 points | |
| 690 | 688 | 7.51% | 1.87% | -5.64 points | |
| 5,059 | 4,966 | 13.44% | 2.71% | -10.73 points | |
| 678 | 677 | 6.47% | 2.05% | -4.43 points | |
| 675 | 675 | 6.87% | 2.55% | -4.32 points | |
| 675 | 674 | 6.31% | 3.08% | -3.23 points | |
| 5,044 | 4,946 | 12.08% | 2.20% | -9.89 points | |
| Source pair unavailable | Unknown | Unknown | Unavailable | Unavailable | Unavailable |
How the comparison works
The rules were fixed before outcomes were analyzed. On each complete Thursday/Friday pair, include a symbol only when Thursday’s nearest expiration is that Friday and Thursday’s close, max pain and total open interest are positive finite numbers. Open interest must be an integer. Match the same symbol to a positive finite Friday close. No threshold above positive open interest, current-universe filter, or price-jump filter was used.
For each observed symbol/expiry:
- Max-pain error: 100 × the absolute difference between Friday close and Thursday max pain, divided by Thursday close.
- No-change error: 100 × the absolute difference between Friday close and Thursday close, divided by Thursday close.
- Improvement: no-change error minus max-pain error. A tie is an absolute difference of at most 0.0000000001 percentage points.
Average these event errors within each Friday, then average the weekly means with equal weight. This primary estimator prevents a week with more eligible symbols from receiving more weight. The secondary summaries below weight every observed event equally instead.
The primary interval comes from 5,000 circular four-calendar-week block resamples, using Python 3.13.15’s
random.Random(20261005) generator. Each replicate makes 13 independent randrange(52)
draws for block starts across the 52 calendar weeks, wraps blocks past December back
to January, and averages available weekly means. Missing calendar weeks remain in place. Interval endpoints
are the 2.5th and 97.5th percentiles with linear interpolation. Whole-week blocks retain shared weekly movements
and some short-run dependence; they assume approximate stationarity and treat the artificial December-to-January
boundary as a valid block. Recurring symbols can remain dependent beyond four weeks.
The weekly aggregate CSV and summary JSON
let readers reproduce the aggregate means and block interval. Values are calculated at full precision;
tables and charts round only for display. Protocol reference: 7b0a4a5538f0.
Secondary view: each event receives equal weight
Across all 72,086 observed events, max pain was closer in 16.31%, tied in 0.37%, and Thursday’s close was closer in 83.32%. These descriptive proportions give larger weeks more influence. They do not use an independent-event confidence interval.
| Measure | Result |
|---|---|
| Max-pain mean absolute error | 9.56% |
| No-change mean absolute error | 2.24% |
| Mean paired improvement | -7.32 points |
| Median paired improvement | -3.67 points |
| Max pain closer / tied / Thursday close closer | 11,758 / 268 / 60,060 |
What these results can and cannot establish
- Retrospective timing. The archive was reconstructed in September 2026. Original publication and revision timestamps are unavailable, so the study does not establish that these exact levels were available to trade in 2025.
- A closing-price comparison. The source-reported underlying close has not been independently verified as official settlement. The historical source includes an unclassified mix of instruments, including index underlyings.
- Source coverage. Historical source symbols were retained, but the archive can omit instruments and dates. Missing Friday symbols are reported, and incomplete weeks have unknown counts. This is not a census of all listed options.
- Corporate actions and extreme values. No split, distribution, deliverable-change or symbol-history adjustment was applied. No outcomes were trimmed or winsorized. Discontinuities and large errors can strongly influence means.
- One year and one horizon. The Thursday-to-Friday rule selects only nearest expirations on the following Friday. It does not represent every maturity, intraday path or market period. Source open interest can be lagged.
- Dependence and interpretation. Circular blocks assume approximate stationarity and a wrapped year boundary. Dependence can last beyond four weeks. The interval describes this resampling convention; the study establishes neither causation nor trading profitability.
Max pain remains a description of option payout concentration for a stated expiration. This sample did not show a smaller closing-price error than the unchanged-price baseline under the declared comparison. That result does not determine a current ticker’s next move.
Sources and downloads
Source: Half on a Double’s archived derived options aggregates. The public data guide names the available fields and access terms; methodology and limitations explain the published measures. Historical source correctness and original publication timestamps remain unverified.
- Download all 52 weekly aggregate rows (CSV), including complete exclusion counts and unavailable weeks.
- Download overall and weekly aggregate results (JSON), including the endpoint, interval convention and coverage dates.
- Comparison chart and weekly chart, both 1600×840 PNGs.
Weekly CSV SHA-256: a8526a886c268f39d2c9d13a5cdbd1087712679506e1b2bc624ec8f90611e511. Reuse is governed by the site’s terms.
Cite or share the study
Half on a Double. “Does max pain predict expiration price? A 2025 comparison.” Published 2026-10-06 (UTC). Retrospective underlying-close observations from 2025-01-03 through 2025-12-19. https://halfonadouble.com/research/max-pain-expiration-2025

Image embed HTML
<a href="https://halfonadouble.com/research/max-pain-expiration-2025"><img src="https://halfonadouble.com/research/max-pain-expiration-2025/comparison.png" alt="In a retrospective 2025 comparison of 72,086 observed events across 47 equally weighted weeks, max-pain mean absolute error was 7.22% of Thursday close versus 2.43% for Thursday's close. Paired improvement was -4.79 percentage points, with a 95% block interval from -5.25 to -4.32. Outcomes are reported underlying closes, not official settlement." width="1600" height="840" loading="lazy"></a>
Read the definitions and current data
Start with the max-pain calculator example and open-interest guide. The nearest max-pain screen and current SPY options snapshot show present-day context, separate from the fixed historical study sample.